DATA GENERATION AND ANALYSIS PROCESS
The RPW science products are produced by the RPW Instrument Team. The data generation and analysis process is described in this section. Science data received by the SOC from the RPW team are made available to end users through the Solar Orbiter archive following the policies described in the Archiving Plan [RD.06]. The procedure for delivery of the Science data from the RPW Instrument Team to the SOC must be fully compliant with the IT-SOC Science Data Delivery ICD (TBW) [AD.02].
Scientific Measurements
Overview
To meet the science objectives defined above, the RPW instrument has to consist of a sophisticated plasma/radio wave receiver system connected to high sensitivity electric and magnetic sensors. Since the receiver system covers a very wide frequency range (quasi-DC to 20 MHz for electric, and 0.1 Hz to 500 kHz for magnetic), different kinds of sensors are used for the measurements.
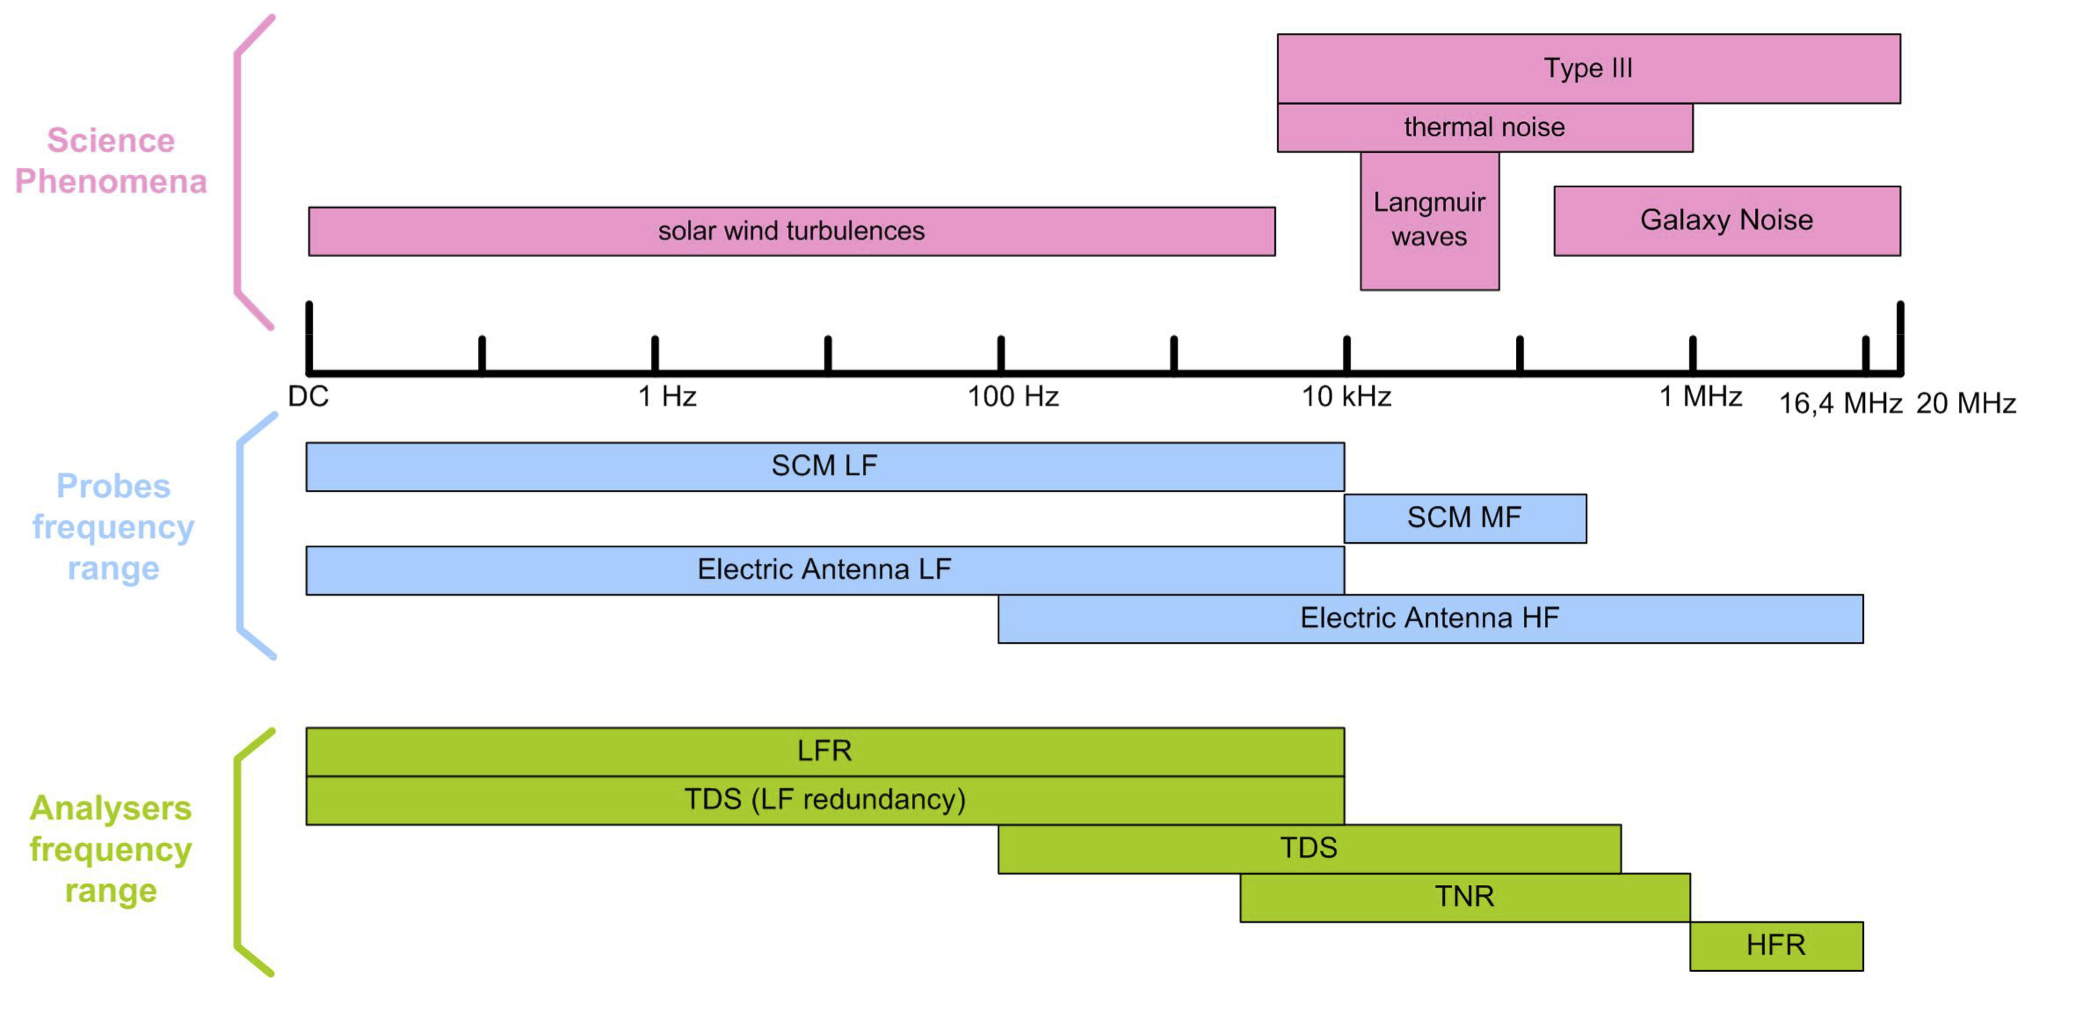
Fig. 2 RPW measurement frequency allocation
The electric antenna (ANT), consisting on a set of three monopoles and the magnetic search coil unit (SCM) are designed to perform correctly for quasi -DC as well as for high frequency measurements. In particular, ANT design is optimised to satisfy the goal of measuring both the quasi-DC/low frequency electric fields and higher frequency radio and thermal noise emissions.
A biasing unit (BIAS) will allow DC electric measurements. The three TDS, LFR and TNR- HFR sub-systems correspond to the core of the receiver system by covering both waveform data and power spectral densities. TDS, LFR and TNR-HFR are connected to a common DPU that will handle commands, data and communication with S/C.
LFR measurements
The science objective of LFR is the study of the electromagnetic wave activity in the extended corona and the solar wind, from a fraction of a Hertz to about 10 kHz, which should cover the electron gyro-frequency and most of the Doppler-shifted frequencies of the low frequency plasma waves. The main waves to be observed in this frequency range are thus kinetic or inertial Alfven waves, ion cyclotron waves, ion acoustic waves, and magnetosonic or whistler mode waves. Their characterization and the determination of their respective role in heating and accelerating the solar wind during its expansion is the main scientific issue addressed by LFR. Another important subject for LFR is the study of the low frequency plasma waves associated to solar wind disturbances, as for instance interplanetary shocks. Characterizing the low frequency waves in the solar wind involves the capability of the LFR to distinguish solitary waves from broadband wave activity, to cover turbulence and plasma instabilities, to identify the wave modes at work. Performing a multi-component analysis of the data is thus mandatory, using either a classical Fourier analysis or another treatment of the waveforms more appropriate to turbulence analysis. Given the limitations in the telemetry, it is necessary to implement specific techniques to take the maximum advantage of the data. The LFR is tailored to optimize the scientific return of the data. The LFR design gives the possibility of mixing different types of output data, from low-level processed data (waveform data) to high-level processed data (averaged spectral matrices and their derived parameters), with various data rate possibilities (continuous or cyclic transmission, adaptable frequency bandwidth as well as adaptable frequency and time resolutions). A number of predefined working modes will be defined, but it will also be possible to define other working modes in flight.
TDS measurements
The main scientific objective of TDS is the study of high frequency plasma waves and electric fields oscillations in the solar wind. The most important phenomenon observed in this frequency range are Langmuir waves associated with solar bursts, interplanetary shocks and other solar wind disturbances. These waves play a significant role in solar wind physics, being the source process of the solar radio emissions. The TDS is designed to study the detailed structure and dynamics of the waves and primarily the poorly understood process of conversion of electron beam energy to electromagnetic radiation via Langmuir waves. The target waves appear close (within 20%) to the local plasma frequency and the conversion to electromagnetic waves can occur both at the plasma frequency and at its first harmonic (2*fp). The waves are typically narrow-band, strongly modulated and appear in bursts lasting from several milliseconds to about one second. Experience from previous experiments (e.g. Cluster, WIND and STEREO) has shown that due to short duration and rich structure, the waves are best studied using broadband waveform data. In particular:
Multiple field components are required to study wave polarization
Magnetic field measurements are needed to properly identify the EM radiation process
Waveform snapshots need to be sufficiently long to capture an entire wave burst.
TDS will be designed to perform waveform measurements fulfilling these requirements, offering a range of configurable parameters to tune the instrument to a present region of solar wind and target process. Since the data volume associated with these measurements is enormous and Langmuir wave bursts are relatively rare and short, the on-board logic will attempt to identify snapshots containing potentially interesting measurements and only select these for downlink. Second science objective of the TDS instrument is the study of interplanetary dust by registering voltage spikes measured by spacecraft antenna in response to an impact of a dust particle on the spacecraft Recent studies have shown that the amplitude and shape of the dust impact can be used to gather information about the size and energy of the impacting particle. Full waveform measurements are in general not necessary for this process. TDS on-board software will scan the data for dust impact signatures and collect statistics of their parameters.
TNR-HFR measurements
TNR-HFR is of prime importance for the RPW science objectives since it provides electric power spectral densities from 4 kHz up to 16MHz and magnetic power spectral densities from 10 kHz up to 500 kHz. Below is a brief overview of the TNR-HFR science objectives:
The TNR-HFR measures the Quasi-thermal Noise due to the motion of solar wind electrons around the electric antennas. The spectroscopy of this noise will provide electron properties such as their density and temperature. The TNR-HFR measures Langmuir-like waves that are frequently observed in the solar wind in association with supra-thermal electron beams produced by either solar flares or accelerated by interplanetary shocks.
The TNR-HFR measures and tracks the solar radio bursts due to particle acceleration and shock waves in the corona and inner heliosphere. By processing cross-correlations between two channels connected to different antennas, the TNR- HFR has direction-finding capabilities for tracking the solar radio bursts. Finally, TNR-HFR is also sensitive to dust impacts via the corresponding plasma cloud and pickup signal on the electric field antennas. Actually, TNR-HFR measures, in the spectral domain, the voltage induced when a dust grain impacting the S/C at high velocity is vaporized and ionized, producing a plasma cloud, which is partially recollected by the target.
Data flow overview
The RPW science data processing is performed by the RPW Operations Centre (ROC), which is located at the Laboratoire d’Etudes Spatiales et d’Instrumentation en Astrophysique (LESIA) in Meudon, France. Figure below gives an overview of the RPW data processing workflow.
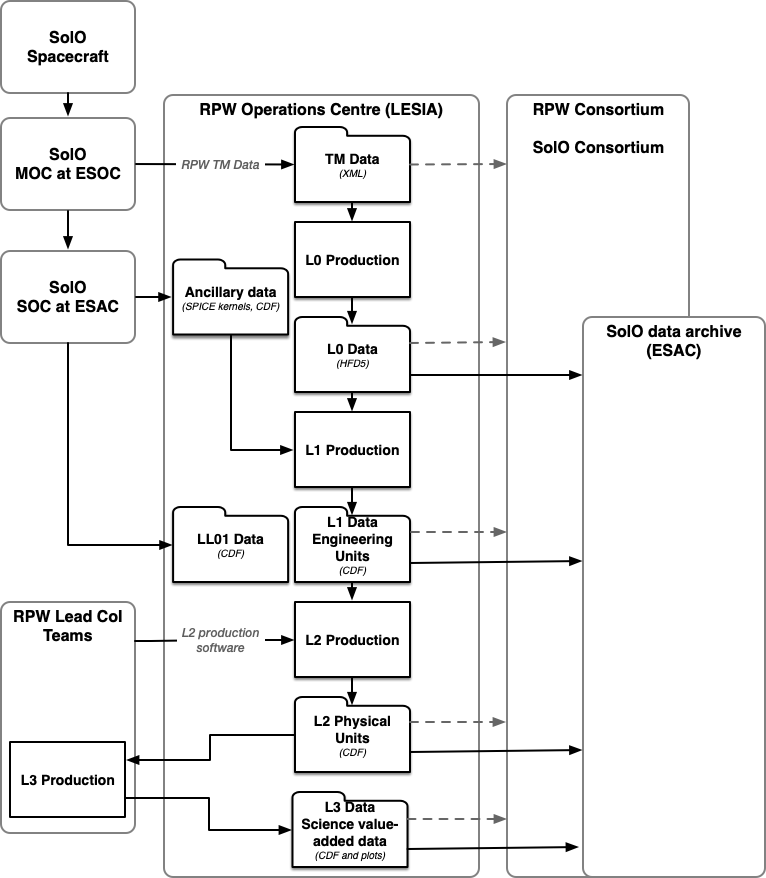
Fig. 3 RPW science data processing overview
The main steps are:
RPW telemetry raw data available at the MOC are requested using EDDS system, as “TmRaw” XML files. In the same time the ROC retrieves: the latest mission ancillary data supplied by SOC, i.e., SPICE kernels and CDF “digest” files [RD.09], the RPW Low Latency data products [RD.10], and the RPW “TcReport” XML files from EDDS.
Received RPW “TmRaw” and “TcReport” EDDS XML files are parsed. New packet elements inside are extracted to be saved into daily “TmRaw” and “TcReport” XML files.
RPW L0 daily file in HDF5 format are generated from the parent daily “TmRaw” and “TcReport” XML files.
RPW L1 files in CDF are written from the parent L0 file. Some L1 files require to known TC parameters to be generated. Internal CDF files are also saved at this stage to store RPW HK data in engineering units.
RPW L2 files in CDF are written from the parent L1 files, ancillary and HK data. The generation of L2 CDF files is performed by the RPW Data Pipeline at ROC, but using the RPW calibration software (RCS) delivered by the RPW Lead CoI analyser/sensor teams.
Summary plots are generated by the ROC from parent L2 files. RPW L3 files are produced by the RPW Lead CoI teams, then delivered to the ROC.
Notes:
All RPW L1/L2 data are written in daily files, except for in-situ shocks (SBM1) and Langmuir Waves (SBM2) selective data, where there is one CDF file per event. Additionally, the ROC will produce specific L1 data products for the Bias unit, i.e., 1 CDF file per Bias sweep and 1 CDF file every month containing the Biased intensity currents applied on each RPW electrical antenna.
RPW L0, L1 and L2 preliminary files will be accessible to the RPW and Solar Orbiter teams within 24 hours after their production at ROC.
RPW L2 CDAG files will be made available to CDAG members at ESAC after 30 days.
RPW L0, L1, L2 and L3 definitive files will be made publicly available at SOAR after 90 days.
The Low Latency data production and distribution are operated by SOC.
At this stage, the ROC does not plan to produce specific ancillary data for RPW.
Data Generation
The following sections describe the process used to produce the data products described in section 4.
L0 - Raw Data
RPW Level 0 files (L0) contains RPW unpacked telemetry data in raw units. There is one L0 daily file generated by the RPW Data Pipeline in the HDF5 format.
The RPW TM data are unpacked using the RPW instrument database (IDB), which contains the instrument telemetry/command packet definitions. The operational version of the RPW IDB is delivered by the Solar Orbiter Mission Operation Centre (MOC) as a part of the Mission information Base (MIB).
The steps performed by the RPW Data Pipeline to produce a L0 daily file is:
Regularly check that new RPW TmRaw and TcReport daily XML files is available in the input directory
If new TmRaw and TcReport daily XML files are found, they are parsed and the telemetry data inside is extracted and analyzed packet by packet. The analysis leads to retrieve the raw value of each packet parameters, from packet header, data field header and source data parts. During the process any group repeater, i.e., loop, found in a packet is separated into blocks and stored as an array in the pipeline memory cache (but the content of each block is not analyzed at this step). The packet creation time in CUC format is also retrieved from packets and split into three unsigned integer variables containing the time coarse and fine parts as well as the time synchronization flag.
The resulting processed telemetry data is then sorted by packet name and creation time and saved into a L0 file as described in the section 4.1.1.1.3. Additionally, metadata are also written from information supplied by the pipeline.
L1 - Engineering data (uncalibrated)
RPW Level 1 files (L1) contains RPW science uncalibrated data in engineering units (TM units).
The overall process to produce L1 files is:
The RPW Data Pipeline checks for L0 file existence in its input directory. In the nominal case, the checking is automatically triggered each time a new L0 file is generated.
If a L0 file is found, the pipeline reads it and retrieves unpacked telemetry data inside.
Depending of the packets stored in the L0 file, the RPW Data Pipeline runs the production of the expected L1 files, using the corresponding CDF master files as templates; there is one CDF master per L1 file. Especially at this step:
The CDF Epoch time is computed and converted from On-Board Time (OBT) to UTC time using the SOC-provided spacecraft clock kernels
The QUALITY_BITMASK CDF zVariable is set from mission and instrument context data (RPW HK, E-FECS, ancillary data)
L2 - Science Data (calibrated)
RPW Level 2 files (L2) contains RPW science calibrated data in physical units (e.g., mV/Hz, W/m^2/Hz, nT, etc.).
The overall process to produce L2 files is:
The RPW Data Pipeline checks for L1 files existence in its input directory. In the nominal case, the checking is automatically triggered each time new L1 files are generated.
If L1 files are provided, then the pipeline calls the RPW calibration software (RCS) in charge of the L2 data production. The RCS are delivered to the ROC by each analyzer (TDS, LFR, THR) and sensor (Bias, SCM) teams with the expected calibration table files (see section 4.1.5).
Resulting L2 files are automatically checked and moved to the target directory for distribution.
Table below gives the list of the RCS and the corresponding list of L2 data products generated.
L3 - Higher level data
TBW
CAL- Calibration data
TBW
ANC - Ancillary data
No ancillary data is produced for RPW.
Validation
The following sections describe the process by which the data products are validated.
Instrument Team Validation
The instrument team validation is described in the RPW Data Validation and Verification Plan (DVVP) [RD.11].
SOC Validation
The SOC will check the data types that the RPW team intends to archive. The SOC might also perform spot checks on contents of the files. The exact procedure in which this routine check will take place is still TBD